viés
Clustering illusion
People tend to perceive meaningful patterns in random sequences of data.
Before presenting a pattern in the data, look for what refutes it.
Nobody looks at a cloud and sees suspended water vapour. They see a dog, a face, a map of Brazil. The cloud has no shape at all, and even so it is impossible not to find one, because looking for patterns is what the brain does for free, all the time, even when there is no pattern to find. Amos Amos TverskyRan, with Kahneman, the experiments that founded behavioural economics: anchoring, availability, the law of small numbers.3 references in this work:1973Availability: a heuristic for judging frequency and probability1971Belief in the law of small numbers1974Judgment under uncertainty: heuristics and biasesSee on Wikipedia ↗See in the bibliography → and Daniel Daniel KahnemanHalf the work this catalogue cites passes through him: anchoring, availability, the endowment effect, peak–end, the two systems.5 references in this work:2011Thinking, fast and slow1966Pupil diameter and load on memory1993When more pain is preferred to less: adding a better end1990Experimental tests of the endowment effect and the Coase theorem1991Anomalies: the endowment effect, loss aversion, and status quo biasSee on Wikipedia ↗See in the bibliography → described the root of this in 1971: we expect a small sample to behave like a large one, and so we read intention where there was only chance. Three weeks of rises in a row are not a trend, just as that cloud is not a dog. But someone is going to draw the trend line over those three weeks.
What the brain does with it
The biological mechanism behind the effect, and how much of it was actually measured.
It is a failure of statistical intuition: genuinely random sequences produce clusters far more often than people expect, and the cluster is read as a pattern. Detecting regularity involves prefrontal circuits and the basal gangliaTogether with the cerebellum, they store what the body learned to do without thinking: typing, swiping, reaching an icon. It is the memory that survives distraction.See it in Memory →See in the glossary →. HuettelOne reference in this work:2002Perceiving patterns in random series: dynamic processing of sequence in prefrontal cortexSee in the bibliography → and colleagues measured this in 2002, with fMRI, and saw the prefrontal cortexThe region behind the forehead, where the person decides, plans and sustains attention. It keeps one thing in focus at a time and inhibits the rest: it is where the bottleneck of conscious decision usually tightens.See it in Memory →See in the glossary → build a model of the patterns that appear by chance in a random series and react when the series breaks them, with a bigger reaction the bigger the pattern the person believed they saw. It is the closest neuroimaging has come to this effect, and nobody has yet measured the version of it that shows up on a metrics dashboard.
This law seems not to change with the body
Who it was measured on, and what changes when the body on the other side is another.
It is a statistical bias and not a sensory one, because it depends on experience with data and not on sight, hearing or touch. Not depending on a sense does not mean not depending on a body. The founding evidence is 84 professional psychologists answering a questionnaire at a conference, people trained in statistics, and the effect showed up in them all the same. How much it changes with schooling and familiarity with numbers nobody has measured.
How design translates it
What to do with it on a screen, without turning a finding into a rule.
How to measure this in your product
On a dashboard, two lines that rise together look like one explaining the other, and they almost never are. What helps is giving the number the company it needs to be read: the margin of error, the sample size, the previous period.
Onde vira manipulação
The same lever, pointed at the person on the other side.
The design process is also subject to the clustering illusion. When exploring a problem, the practitioner needs to actively seek what refutes their initial findings, not only what confirms them. Without that, the first pattern to appear becomes a conclusion, and the chart that shows it becomes proof.
Where it breaks
Where the law does not hold, holds less, or holds in reverse.
The same sensitivity that invents patterns in noise is the one that finds real patterns, and switching it off is not an option nor would it be good. What can be done is procedure: say, before looking at the data, what would count as a pattern, and look afterwards.
Um caso
A real product where this showed up, with what happened and where to check it.
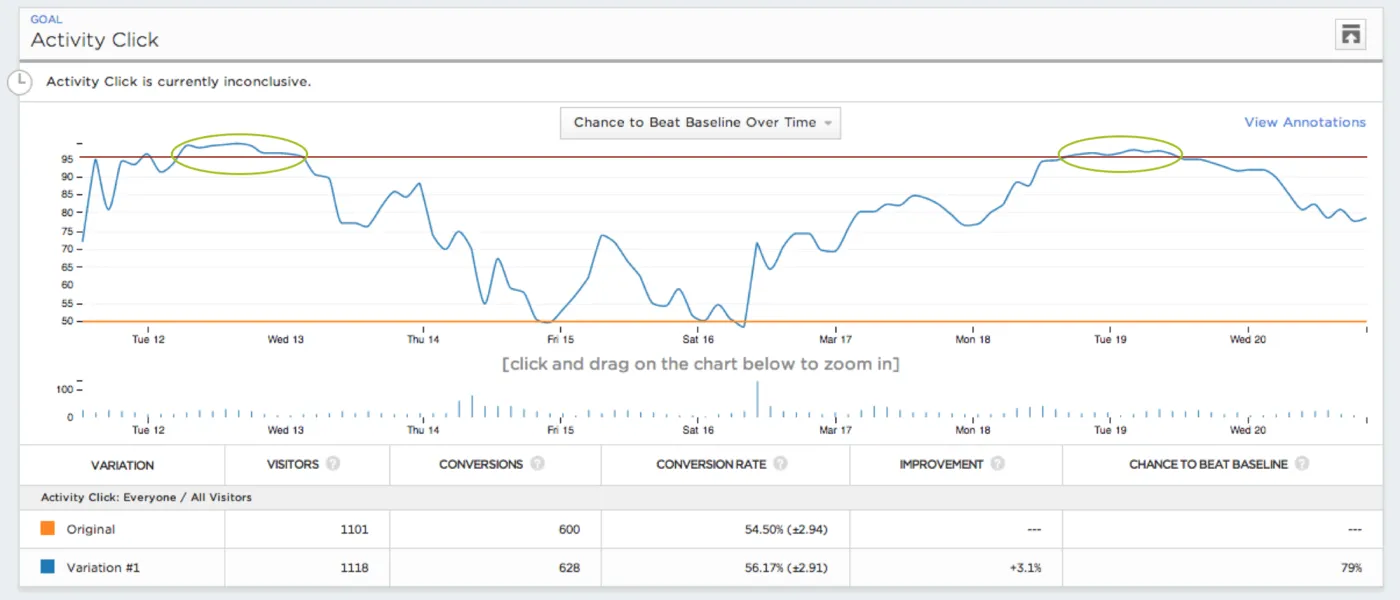
The dashboard that declared a winner where there was only noise
Optimizely · Statistics for the Internet Age · Uso editorial
Optimizely sells A/B tests, and in 2015 it explained why it had to change the statistics in its own product. Customers watched the dashboard while the test was running and stopped as soon as one of the versions seemed to be winning. The company simulated tests in which the two versions were identical, that is, with no real difference to find. Even so, with five thousand visitors, more than 57% of those tests showed a winner or a loser at some point, if the dashboard was checked after every visitor. It is the clustering illusion in your workplace. Two curves generated by chance separate for a moment, and whoever is watching reads the separation as a pattern and the pattern as a result. The fix was to change the method, with a calculation that keeps the error at 3%. The numbers come from simulation, and the source speaks of peeking at the test, not of the clustering illusion. What interests me is that the illusion was systematic enough to demand a redesign, and that it is born on the dashboard.
Experimente
A piece to check in your own body what the text has just claimed.
Find the pattern that does not exist
Below are three fields of dots. Look calmly and click the one that seems to form some figure, cluster or drawing — even vaguely.
The brain is a pattern-finding machine. The cost shows up in front of real data: on a metrics dashboard, the same machine sees a trend in fluctuation and a cause in coincidence.
Neighbouring concepts
Structures measured in this very phenomenon
Structures linked by a bridge of my own
Sibling concepts
Fontes
Enunciado citado de Tversky; Kahneman, 1971.
- TVERSKY, A.; KAHNEMAN, D. Belief in the law of small numbers. Psychological Bulletin, v. 76, n. 2, p. 105-110, 1971. DOI
Leitura complementar: Ilusão de agrupamento Wikipédia